This is the multi-page printable view of this section. Click here to print.
PERFORMANCE
1 - HugeGraph BenchMark Performance
Note:
The current performance metrics are based on an earlier version. The latest version has significant improvements in both performance and functionality. We encourage you to refer to the most recent release featuring autonomous distributed storage and enhanced computational push down capabilities. Alternatively, you may wait for the community to update the data with these enhancements.
1 Test environment
1.1 Hardware information
| CPU | Memory | 网卡 | 磁盘 |
|---|---|---|---|
| 48 Intel(R) Xeon(R) CPU E5-2650 v4 @ 2.20GHz | 128G | 10000Mbps | 750GB SSD |
1.2 Software information
1.2.1 Test cases
Testing is done using the graphdb-benchmark, a benchmark suite for graph databases. This benchmark suite mainly consists of four types of tests:
- Massive Insertion, which involves batch insertion of vertices and edges, with a certain number of vertices or edges being submitted at once.
- Single Insertion, which involves the immediate insertion of each vertex or edge, one at a time.
- Query, which mainly includes the basic query operations of the graph database:
- Find Neighbors, which queries the neighbors of all vertices.
- Find Adjacent Nodes, which queries the adjacent vertices of all edges.
- Find the Shortest Path, which queries the shortest path from the first vertex to 100 random vertices.
- Clustering, which is a community detection algorithm based on the Louvain Method.
1.2.2 Test dataset
Tests are conducted using both synthetic and real data.
MIW, SIW, and QW use SNAP datasets:
CW uses synthetic data generated by the LFR-Benchmark generator.
The size of the datasets used in this test is not mentioned.
| Name | Number of Vertices | Number of Edges | File Size |
|---|---|---|---|
| email-enron.txt | 36,691 | 367,661 | 4MB |
| com-youtube.ungraph.txt | 1,157,806 | 2,987,624 | 38.7MB |
| amazon0601.txt | 403,393 | 3,387,388 | 47.9MB |
| com-lj.ungraph.txt | 3997961 | 34681189 | 479MB |
1.3 Service configuration
HugeGraph version: 0.5.6, RestServer and Gremlin Server and backends are on the same server
- RocksDB version: rocksdbjni-5.8.6
Titan version: 0.5.4, using thrift+Cassandra mode
- Cassandra version: cassandra-3.10, commit-log and data use SSD together
Neo4j version: 2.0.1
The Titan version adapted by graphdb-benchmark is 0.5.4.
2 Test results
2.1 Batch insertion performance
| Backend | email-enron(30w) | amazon0601(300w) | com-youtube.ungraph(300w) | com-lj.ungraph(3000w) |
|---|---|---|---|---|
| HugeGraph | 0.629 | 5.711 | 5.243 | 67.033 |
| Titan | 10.15 | 108.569 | 150.266 | 1217.944 |
| Neo4j | 3.884 | 18.938 | 24.890 | 281.537 |
Instructions
- The data scale is in the table header in terms of edges
- The data in the table is the time for batch insertion, in seconds
- For example, HugeGraph(RocksDB) spent 5.711 seconds to insert 3 million edges of the amazon0601 dataset.
Conclusion
- The performance of batch insertion: HugeGraph(RocksDB) > Neo4j > Titan(thrift+Cassandra)
2.2 Traversal performance
2.2.1 Explanation of terms
- FN(Find Neighbor): Traverse all vertices, find the adjacent edges based on each vertex, and use the edges and vertices to find the other vertices adjacent to the original vertex.
- FA(Find Adjacent): Traverse all edges, get the source vertex and target vertex based on each edge.
2.2.2 FN performance
| Backend | email-enron(3.6w) | amazon0601(40w) | com-youtube.ungraph(120w) | com-lj.ungraph(400w) |
|---|---|---|---|---|
| HugeGraph | 4.072 | 45.118 | 66.006 | 609.083 |
| Titan | 8.084 | 92.507 | 184.543 | 1099.371 |
| Neo4j | 2.424 | 10.537 | 11.609 | 106.919 |
Instructions
- The data in the table header “()” represents the data scale, in terms of vertices.
- The data in the table represents the time spent traversing vertices in seconds.
- For example, HugeGraph uses the RocksDB backend to traverse all vertices in amazon0601, and search for adjacent edges and another vertex, which takes a total of 45.118 seconds.
2.2.3 FA performance
| Backend | email-enron(30w) | amazon0601(300w) | com-youtube.ungraph(300w) | com-lj.ungraph(3000w) |
|---|---|---|---|---|
| HugeGraph | 1.540 | 10.764 | 11.243 | 151.271 |
| Titan | 7.361 | 93.344 | 169.218 | 1085.235 |
| Neo4j | 1.673 | 4.775 | 4.284 | 40.507 |
Explanation
- The data size in the header “()” is based on the number of vertices.
- The data in the table is the time it takes to traverse the vertices in seconds.
- For example, HugeGraph with RocksDB backend traverses all vertices in the amazon0601 dataset, and it looks up adjacent edges and other vertices, taking a total of 45.118 seconds.
Conclusion
- Traversal performance: Neo4j > HugeGraph(RocksDB) > Titan(thrift+Cassandra)
2.3 Performance of Common Graph Analysis Methods in HugeGraph
Terminology Explanation
- FS (Find Shortest Path): finding the shortest path between two vertices
- K-neighbor: all vertices that can be reached by traversing K hops (including 1, 2, 3…(K-1) hops) from the starting vertex
- K-out: all vertices that can be reached by traversing exactly K out-edges from the starting vertex.
FS performance
| Backend | email-enron(30w) | amazon0601(300w) | com-youtube.ungraph(300w) | com-lj.ungraph(3000w) |
|---|---|---|---|---|
| HugeGraph | 0.494 | 0.103 | 3.364 | 8.155 |
| Titan | 11.818 | 0.239 | 377.709 | 575.678 |
| Neo4j | 1.719 | 1.800 | 1.956 | 8.530 |
Explanation
- The data in the header “()” represents the data scale in terms of edges
- The data in the table is the time it takes to find the shortest path from the first vertex to 100 randomly selected vertices in seconds
- For example, HugeGraph using the RocksDB backend to find the shortest path from the first vertex to 100 randomly selected vertices in the amazon0601 graph took a total of 0.103s.
Conclusion
- In scenarios with small data size or few vertex relationships, HugeGraph outperforms Neo4j and Titan.
- As the data size increases and the degree of vertex association increases, the performance of HugeGraph and Neo4j tends to be similar, both far exceeding Titan.
K-neighbor Performance
| Vertex | Depth | Degree 1 | Degree 2 | Degree 3 | Degree 4 | Degree 5 | Degree 6 |
|---|---|---|---|---|---|---|---|
| v1 | Time | 0.031s | 0.033s | 0.048s | 0.500s | 11.27s | OOM |
| v111 | Time | 0.027s | 0.034s | 0.115s | 1.36s | OOM | – |
| v1111 | Time | 0.039s | 0.027s | 0.052s | 0.511s | 10.96s | OOM |
Explanation
- HugeGraph-Server’s JVM memory is set to 32GB and may experience OOM when the data is too large.
K-out performance
| Vertex | Depth | 1st Degree | 2nd Degree | 3rd Degree | 4th Degree | 5th Degree | 6th Degree |
|---|---|---|---|---|---|---|---|
| v1 | Time | 0.054s | 0.057s | 0.109s | 0.526s | 3.77s | OOM |
| Degree | 10 | 133 | 2453 | 50,830 | 1,128,688 | ||
| v111 | Time | 0.032s | 0.042s | 0.136s | 1.25s | 20.62s | OOM |
| Degree | 10 | 211 | 4944 | 113150 | 2,629,970 | ||
| v1111 | Time | 0.039s | 0.045s | 0.053s | 1.10s | 2.92s | OOM |
| Degree | 10 | 140 | 2555 | 50825 | 1,070,230 |
Explanation
- The JVM memory of HugeGraph-Server is set to 32GB, and OOM may occur when the data is too large.
Conclusion
- In the FS scenario, HugeGraph outperforms Neo4j and Titan in terms of performance.
- In the K-neighbor and K-out scenarios, HugeGraph can achieve results returned within seconds within 5 degrees.
2.4 Comprehensive Performance Test - CW
| Database | Size 1000 | Size 5000 | Size 10000 | Size 20000 |
|---|---|---|---|---|
| HugeGraph(core) | 20.804 | 242.099 | 744.780 | 1700.547 |
| Titan | 45.790 | 820.633 | 2652.235 | 9568.623 |
| Neo4j | 5.913 | 50.267 | 142.354 | 460.880 |
Explanation
- The “scale” is based on the number of vertices.
- The data in the table is the time required to complete community discovery in seconds. For example, if HugeGraph uses the RocksDB backend and operates on a dataset of 10,000 vertices, and the community aggregation is no longer changing, it takes 744.780 seconds.
- The CW test is a comprehensive evaluation of CRUD operations.
- In this test, HugeGraph, like Titan, did not use the client and directly operated on the core.
Conclusion
- Performance of community detection algorithm: Neo4j > HugeGraph > Titan
2 - HugeGraph-API Performance
The HugeGraph API performance test mainly tests HugeGraph-Server’s ability to concurrently process RESTful API requests, including:
- Single insertion of vertices/edges
- Batch insertion of vertices/edges
- Vertex/Edge Queries
For the performance test of the RESTful API of each release version of HugeGraph, please refer to:
Updates coming soon, stay tuned!
2.1 - v0.5.6 Stand-alone(RocksDB)
Note:
The current performance metrics are based on an earlier version. The latest version has significant improvements in both performance and functionality. We encourage you to refer to the most recent release featuring autonomous distributed storage and enhanced computational push down capabilities. Alternatively, you may wait for the community to update the data with these enhancements.
1 Test environment
Compressed machine information:
| CPU | Memory | 网卡 | 磁盘 |
|---|---|---|---|
| 48 Intel(R) Xeon(R) CPU E5-2650 v4 @ 2.20GHz | 128G | 10000Mbps | 750GB SSD,2.7T HDD |
- Information about the machine used to generate loads: configured the same as the machine that is being tested under load.
- Testing tool: Apache JMeter 2.5.1
Note: The load-generating machine and the machine under test are located in the same local network.
2 Test description
2.1 Definition of terms (the unit of time is ms)
- Samples: The total number of threads completed in the current scenario.
- Average: The average response time.
- Median: The statistical median of the response time.
- 90% Line: The response time below which 90% of all threads fall.
- Min: The minimum response time.
- Max: The maximum response time.
- Error: The error rate.
- Throughput: The number of requests processed per unit of time.
- KB/sec: Throughput measured in terms of data transferred per second.
2.2 Underlying storage
RocksDB is used for backend storage, HugeGraph and RocksDB are both started on the same machine, and the configuration files related to the server remain as default except for the modification of the host and port.
3 Summary of performance results
- The speed of inserting a single vertex and edge in HugeGraph is about 1w per second
- The batch insertion speed of vertices and edges is much faster than the single insertion speed
- The concurrency of querying vertices and edges by id can reach more than 13000, and the average delay of requests is less than 50ms
4 Test results and analysis
4.1 batch insertion
4.1.1 Upper limit stress testing
Test methods
The upper limit of stress testing is to continuously increase the concurrency and test whether the server can still provide services normally.
Stress Parameters
Duration: 5 minutes
Maximum insertion speed for vertices:
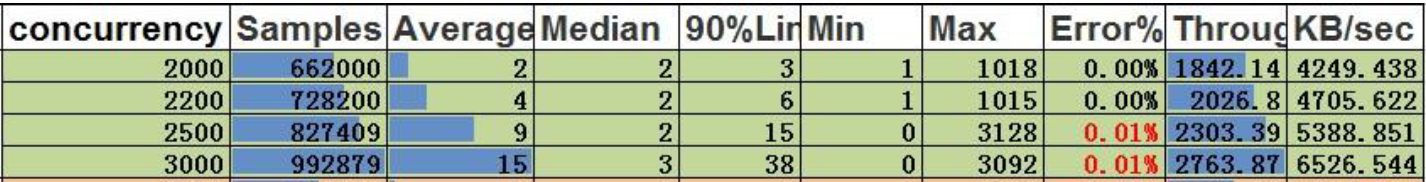
in conclusion:
- With a concurrency of 2200, the throughput for vertices is 2026.8. This means that the system can process data at a rate of 405360 per second (2026.8 * 200).
Maximum insertion speed for edges
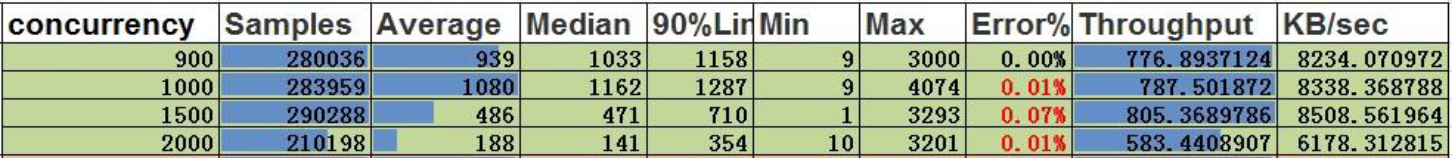
Conclusion:
- With a concurrency of 900, the throughput for edges is 776.9. This means that the system can process data at a rate of 388450 per second (776.9 * 500).
4.2 Single insertion
4.2.1 Stress limit testing
Test Methods
Stress limit testing is a process of continuously increasing the concurrency level to test the upper limit of the server’s ability to provide normal service.
Stress parameters
- Duration: 5 minutes.
- Service exception indicator: Error rate greater than 0.00%.
Single vertex insertion
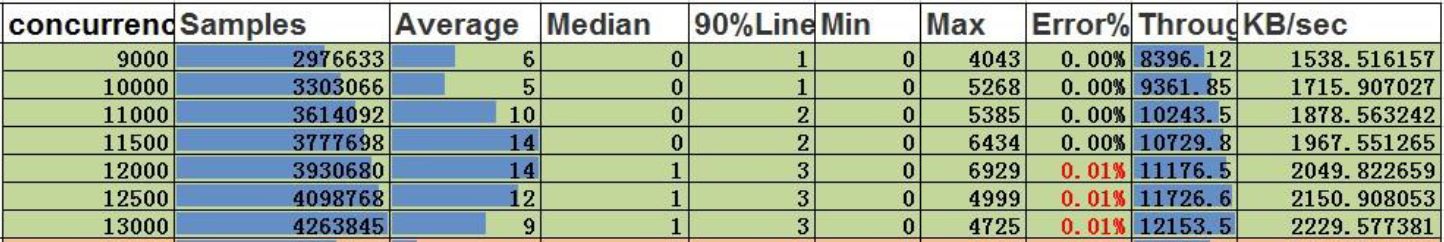
Conclusion:
- With a concurrency of 11500, the throughput is 10730. This means that the system can handle a single concurrent insertion of vertices at a concurrency level of 11500.
Single edge insertion
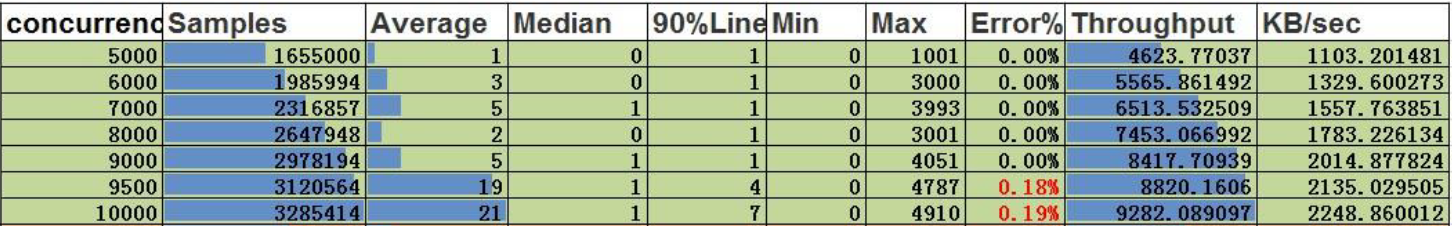
Conclusion:
- With a concurrency of 9000, the throughput is 8418. This means that the system can handle a single concurrent insertion of edges at a concurrency level of 9000.
4.3 Search by ID
4.3.1 Stress test upper limit
Testing method
Continuously increasing the concurrency level to test the upper limit of the server’s ability to provide service under normal conditions.
stress parameters
- Duration: 5 minutes
- Service abnormality indicator: error rate greater than 0.00%
Querying vertices by ID
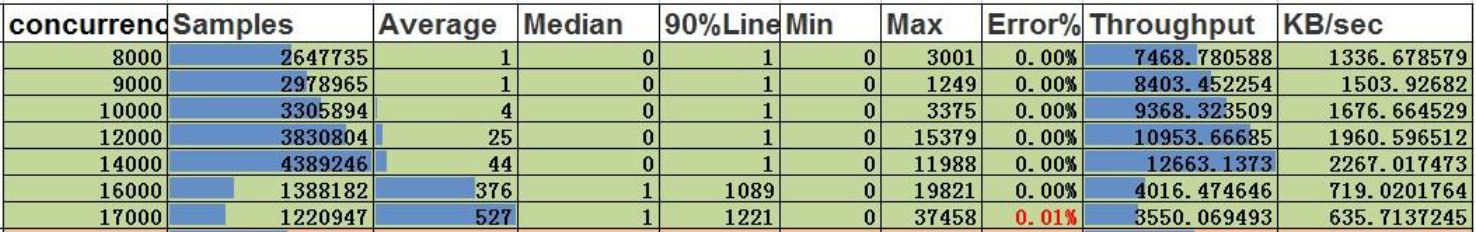
Conclusion:
- Concurrency is 14,000, throughput is 12,663. The concurrency capacity for querying vertices by ID is 14,000, with an average delay of 44ms.
Querying edges by ID
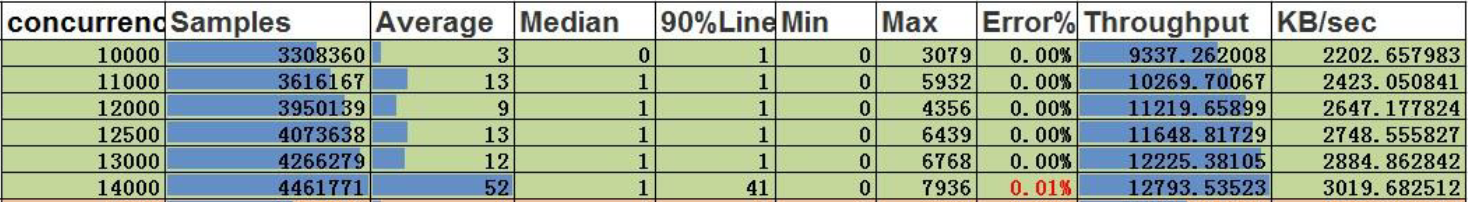
Conclusion:
- Concurrency is 13,000, throughput is 12,225. The concurrency capacity for querying edges by ID is 13,000, with an average delay of 12ms.
2.2 - v0.5.6 Cluster(Cassandra)
Note:
The current performance metrics are based on an earlier version. The latest version has significant improvements in both performance and functionality. We encourage you to refer to the most recent release featuring autonomous distributed storage and enhanced computational push down capabilities. Alternatively, you may wait for the community to update the data with these enhancements.
1 Test environment
Compressed machine information
| CPU | Memory | 网卡 | 磁盘 |
|---|---|---|---|
| 48 Intel(R) Xeon(R) CPU E5-2650 v4 @ 2.20GHz | 128G | 10000Mbps | 750GB SSD,2.7T HDD |
- Starting Pressure Machine Information: Configure the same as the compressed machine.
- Testing tool: Apache JMeter 2.5.1.
Note: The machine used to initiate the load and the machine being tested are located in the same data center (or server room)
2 Test Description
2.1 Definition of terms (the unit of time is ms)
- Samples – The total number of threads completed in this scenario.
- Average – The average response time.
- Median – The median response time in statistical terms.
- 90% Line – The response time below which 90% of all threads fall.
- Min – The minimum response time.
- Max – The maximum response time.
- Error – The error rate.
- Throughput – The number of transactions processed per unit of time.
- KB/sec – The throughput measured in terms of data transmitted per second.
2.2 Low-Level Storage
A 15-node Cassandra cluster is used for backend storage. HugeGraph and the Cassandra cluster are located on separate servers. Server-related configuration files are modified only for host and port settings, while the rest remain default.
3 Summary of Performance Results
- The speed of a single vertex and edge insertion in HugeGraph is 9000 and 4500 per second, respectively.
- The speed of bulk vertex and edge insertion is 50,000 and 150,000 per second, respectively, which is much higher than the single insertion speed.
- The concurrency for querying vertices and edges by ID can reach more than 12,000, and the average request delay is less than 70ms.
4 Test Results and Analysis
4.1 Batch Insertion
4.1.1 Pressure Upper Limit Test
Test Method
Continuously increase the concurrency level to test the upper limit of the server’s ability to provide services.
Pressure Parameters
Duration: 5 minutes.
Maximum Insertion Speed of Vertices:
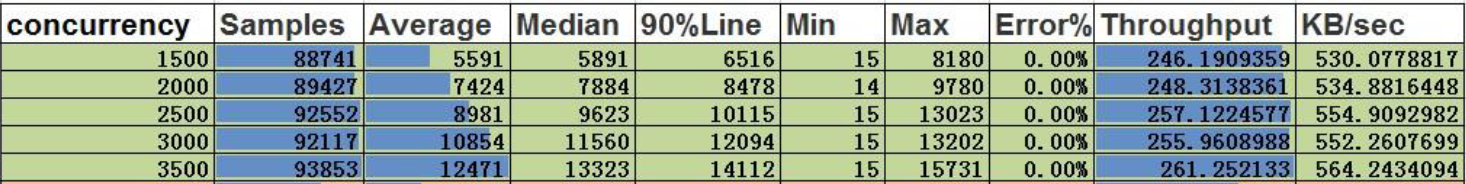
Conclusion:
- At a concurrency level of 3500, the throughput of vertices is 261, and the amount of data processed per second is 52,200 (261 * 200).
Maximum Insertion Speed of Edges:

Conclusion:
- At a concurrency level of 1000, the throughput of edges is 323, and the amount of data processed per second is 161,500 (323 * 500).
4.2 Single Insertion
4.2.1 Pressure Upper Limit Test
Test Method
Continuously increase the concurrency level to test the upper limit of the server’s ability to provide services.
Pressure Parameters
- Duration: 5 minutes.
- Service exception mark: Error rate greater than 0.00%.
Single Insertion of Vertices:
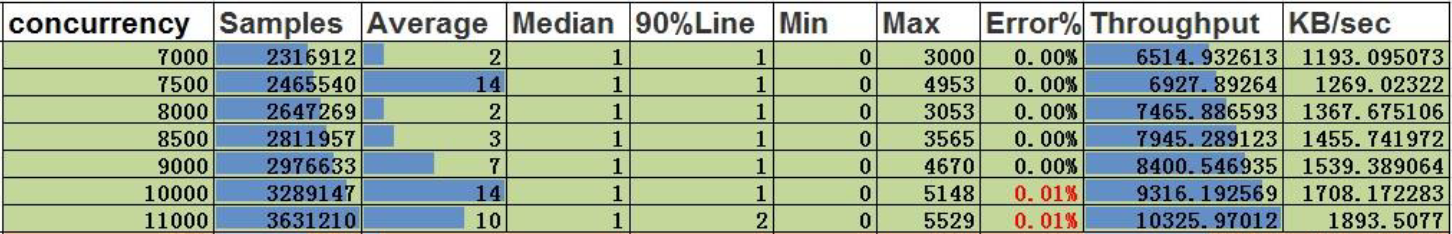
Conclusion:
- At a concurrency level of 9000, the throughput is 8400, and the single-insertion concurrency capability for vertices is 9000.
Single Insertion of Edges:
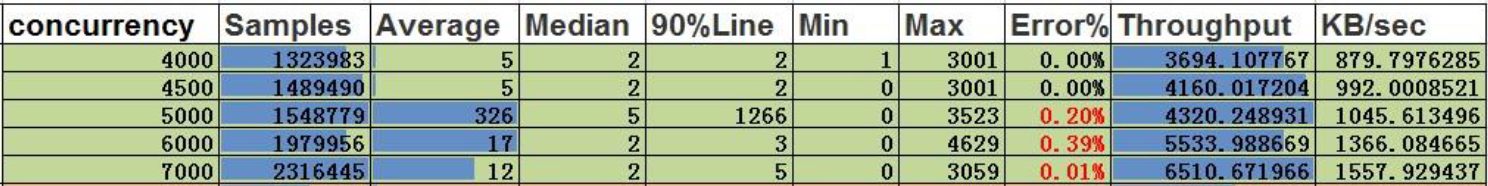
Conclusion:
- At a concurrency level of 4500, the throughput is 4160, and the single-insertion concurrency capability for edges is 4500.
4.3 Query by ID
4.3.1 Pressure Upper Limit Test
Test Method
Continuously increase the concurrency and test the upper limit of the pressure that the server can still provide services normally.
Pressure Parameters
- Duration: 5 minutes
- Service exception flag: error rate greater than 0.00%
Query by ID for vertices
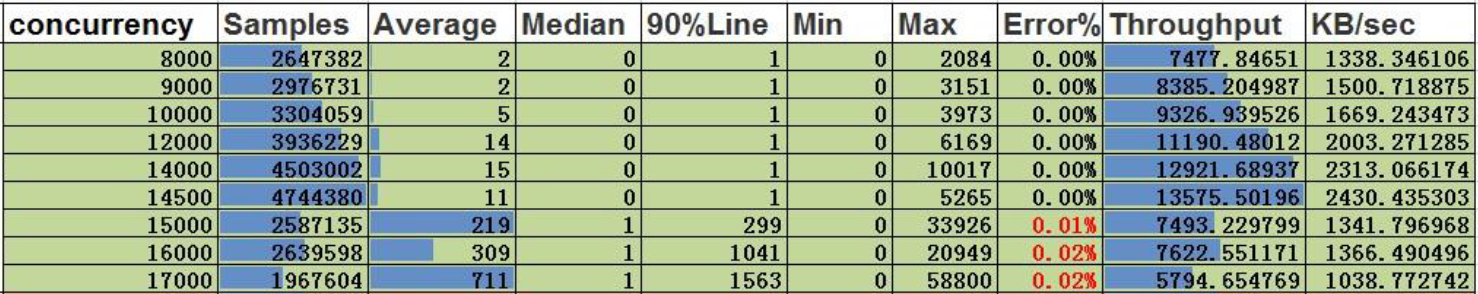
Conclusion:
- The concurrent capacity of the vertex search by ID is 14500, with a throughput of 13576 and an average delay of 11ms.
Edge search by ID
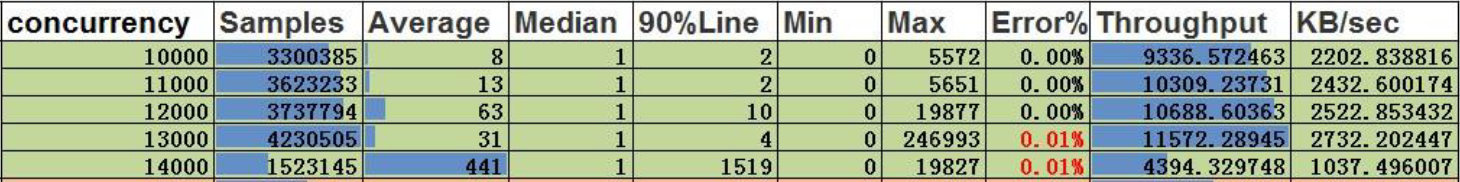
Conclusion:
- For edge ID-based queries, the server’s concurrent capacity is up to 12,000, with a throughput of 10,688 and an average latency of 63ms.
3 - HugeGraph-Loader Performance
Note:
The current performance metrics are based on an earlier version. The latest version has significant improvements in both performance and functionality. We encourage you to refer to the most recent release featuring autonomous distributed storage and enhanced computational push down capabilities. Alternatively, you may wait for the community to update the data with these enhancements.
Use Cases
When the number of graph data to be batch inserted (including vertices and edges) is at the billion level or below, or the total data size is less than TB, the HugeGraph-Loader tool can be used to continuously and quickly import graph data.
Performance
The test uses the edge data of website.
RocksDB single-machine performance (Update: multi-raft + rocksdb cluster is supported now)
- When the label index is turned off, 228k edges/s.
- When the label index is turned on, 153k edges/s.
Cassandra cluster performance
- When label index is turned on by default, 63k edges/s.
4 -
1 测试环境
1.1 硬件信息
| CPU | Memory | 网卡 | 磁盘 |
|---|---|---|---|
| 48 Intel(R) Xeon(R) CPU E5-2650 v4 @ 2.20GHz | 128G | 10000Mbps | 750GB SSD |
1.2 软件信息
1.2.1 测试用例
测试使用graphdb-benchmark,一个图数据库测试集。该测试集主要包含4类测试:
Massive Insertion,批量插入顶点和边,一定数量的顶点或边一次性提交
Single Insertion,单条插入,每个顶点或者每条边立即提交
Query,主要是图数据库的基本查询操作:
- Find Neighbors,查询所有顶点的邻居
- Find Adjacent Nodes,查询所有边的邻接顶点
- Find Shortest Path,查询第一个顶点到100个随机顶点的最短路径
Clustering,基于Louvain Method的社区发现算法
1.2.2 测试数据集
测试使用人造数据和真实数据
MIW、SIW和QW使用SNAP数据集
CW使用LFR-Benchmark generator生成的人造数据
本测试用到的数据集规模
| 名称 | vertex数目 | edge数目 | 文件大小 |
|---|---|---|---|
| email-enron.txt | 36,691 | 367,661 | 4MB |
| com-youtube.ungraph.txt | 1,157,806 | 2,987,624 | 38.7MB |
| amazon0601.txt | 403,393 | 3,387,388 | 47.9MB |
1.3 服务配置
- HugeGraph版本:0.4.4,RestServer和Gremlin Server和backends都在同一台服务器上
- Cassandra版本:cassandra-3.10,commit-log 和data共用SSD
- RocksDB版本:rocksdbjni-5.8.6
- Titan版本:0.5.4, 使用thrift+Cassandra模式
graphdb-benchmark适配的Titan版本为0.5.4
2 测试结果
2.1 Batch插入性能
| Backend | email-enron(30w) | amazon0601(300w) | com-youtube.ungraph(300w) |
|---|---|---|---|
| Titan | 9.516 | 88.123 | 111.586 |
| RocksDB | 2.345 | 14.076 | 16.636 |
| Cassandra | 11.930 | 108.709 | 101.959 |
| Memory | 3.077 | 15.204 | 13.841 |
说明
- 表头"()“中数据是数据规模,以边为单位
- 表中数据是批量插入的时间,单位是s
- 例如,HugeGraph使用RocksDB插入amazon0601数据集的300w条边,花费14.076s,速度约为21w edges/s
结论
- RocksDB和Memory后端插入性能优于Cassandra
- HugeGraph和Titan同样使用Cassandra作为后端的情况下,插入性能接近
2.2 遍历性能
2.2.1 术语说明
- FN(Find Neighbor), 遍历所有vertex, 根据vertex查邻接edge, 通过edge和vertex查other vertex
- FA(Find Adjacent), 遍历所有edge,根据edge获得source vertex和target vertex
2.2.2 FN性能
| Backend | email-enron(3.6w) | amazon0601(40w) | com-youtube.ungraph(120w) |
|---|---|---|---|
| Titan | 7.724 | 70.935 | 128.884 |
| RocksDB | 8.876 | 65.852 | 63.388 |
| Cassandra | 13.125 | 126.959 | 102.580 |
| Memory | 22.309 | 207.411 | 165.609 |
说明
- 表头”()“中数据是数据规模,以顶点为单位
- 表中数据是遍历顶点花费的时间,单位是s
- 例如,HugeGraph使用RocksDB后端遍历amazon0601的所有顶点,并查找邻接边和另一顶点,总共耗时65.852s
2.2.3 FA性能
| Backend | email-enron(30w) | amazon0601(300w) | com-youtube.ungraph(300w) |
|---|---|---|---|
| Titan | 7.119 | 63.353 | 115.633 |
| RocksDB | 6.032 | 64.526 | 52.721 |
| Cassandra | 9.410 | 102.766 | 94.197 |
| Memory | 12.340 | 195.444 | 140.89 |
说明
- 表头”()“中数据是数据规模,以边为单位
- 表中数据是遍历边花费的时间,单位是s
- 例如,HugeGraph使用RocksDB后端遍历amazon0601的所有边,并查询每条边的两个顶点,总共耗时64.526s
结论
- HugeGraph RocksDB > Titan thrift+Cassandra > HugeGraph Cassandra > HugeGraph Memory
2.3 HugeGraph-图常用分析方法性能
术语说明
- FS(Find Shortest Path), 寻找最短路径
- K-neighbor,从起始vertex出发,通过K跳边能够到达的所有顶点, 包括1, 2, 3…(K-1), K跳边可达vertex
- K-out, 从起始vertex出发,恰好经过K跳out边能够到达的顶点
FS性能
| Backend | email-enron(30w) | amazon0601(300w) | com-youtube.ungraph(300w) |
|---|---|---|---|
| Titan | 11.333 | 0.313 | 376.06 |
| RocksDB | 44.391 | 2.221 | 268.792 |
| Cassandra | 39.845 | 3.337 | 331.113 |
| Memory | 35.638 | 2.059 | 388.987 |
说明
- 表头”()“中数据是数据规模,以边为单位
- 表中数据是找到从第一个顶点出发到达随机选择的100个顶点的最短路径的时间,单位是s
- 例如,HugeGraph使用RocksDB查找第一个顶点到100个随机顶点的最短路径,总共耗时2.059s
结论
- 在数据规模小或者顶点关联关系少的场景下,Titan最短路径性能优于HugeGraph
- 随着数据规模增大且顶点的关联度增高,HugeGraph最短路径性能优于Titan
K-neighbor性能
| 顶点 | 深度 | 一度 | 二度 | 三度 | 四度 | 五度 | 六度 |
|---|---|---|---|---|---|---|---|
| v1 | 时间 | 0.031s | 0.033s | 0.048s | 0.500s | 11.27s | OOM |
| v111 | 时间 | 0.027s | 0.034s | 0.115 | 1.36s | OOM | – |
| v1111 | 时间 | 0.039s | 0.027s | 0.052s | 0.511s | 10.96s | OOM |
说明
- HugeGraph-Server的JVM内存设置为32GB,数据量过大时会出现OOM
K-out性能
| 顶点 | 深度 | 一度 | 二度 | 三度 | 四度 | 五度 | 六度 |
|---|---|---|---|---|---|---|---|
| v1 | 时间 | 0.054s | 0.057s | 0.109s | 0.526s | 3.77s | OOM |
| 度 | 10 | 133 | 2453 | 50,830 | 1,128,688 | ||
| v111 | 时间 | 0.032s | 0.042s | 0.136s | 1.25s | 20.62s | OOM |
| 度 | 10 | 211 | 4944 | 113150 | 2,629,970 | ||
| v1111 | 时间 | 0.039s | 0.045s | 0.053s | 1.10s | 2.92s | OOM |
| 度 | 10 | 140 | 2555 | 50825 | 1,070,230 |
说明
- HugeGraph-Server的JVM内存设置为32GB,数据量过大时会出现OOM
结论
- FS场景,HugeGraph性能优于Titan
- K-neighbor和K-out场景,HugeGraph能够实现在5度范围内秒级返回结果
2.4 图综合性能测试-CW
| 数据库 | 规模1000 | 规模5000 | 规模10000 | 规模20000 |
|---|---|---|---|---|
| Titan | 45.943 | 849.168 | 2737.117 | 9791.46 |
| Memory(core) | 41.077 | 1825.905 | * | * |
| Cassandra(core) | 39.783 | 862.744 | 2423.136 | 6564.191 |
| RocksDB(core) | 33.383 | 199.894 | 763.869 | 1677.813 |
说明
- “规模"以顶点为单位
- 表中数据是社区发现完成需要的时间,单位是s,例如HugeGraph使用RocksDB后端在规模10000的数据集,社区聚合不再变化,需要耗时763.869s
- “*“表示超过10000s未完成
- CW测试是CRUD的综合评估
- 后三者分别是HugeGraph的不同后端,该测试中HugeGraph跟Titan一样,没有通过client,直接对core操作
结论
- HugeGraph在使用Cassandra后端时,性能略优于Titan,随着数据规模的增大,优势越来越明显,数据规模20000时,比Titan快30%
- HugeGraph在使用RocksDB后端时,性能远高于Titan和HugeGraph的Cassandra后端,分别比两者快了6倍和4倍