HugeGraph-API Performance
The HugeGraph API performance test mainly tests HugeGraph-Server’s ability to concurrently process RESTful API requests, including:
- Single insertion of vertices/edges
- Batch insertion of vertices/edges
- Vertex/Edge Queries
For the performance test of the RESTful API of each release version of HugeGraph, please refer to:
Updates coming soon, stay tuned!
1 - v0.5.6 Stand-alone(RocksDB)
Note:
The current performance metrics are based on an earlier version. The latest version has significant
improvements in both performance and functionality. We encourage you to refer to the most recent release featuring
autonomous distributed storage and enhanced computational push down capabilities. Alternatively,
you may wait for the community to update the data with these enhancements.
1 Test environment
Compressed machine information:
| CPU | Memory | 网卡 | 磁盘 |
|---|
| 48 Intel(R) Xeon(R) CPU E5-2650 v4 @ 2.20GHz | 128G | 10000Mbps | 750GB SSD,2.7T HDD |
- Information about the machine used to generate loads: configured the same as the machine that is being tested under load.
- Testing tool: Apache JMeter 2.5.1
Note: The load-generating machine and the machine under test are located in the same local network.
2 Test description
2.1 Definition of terms (the unit of time is ms)
- Samples: The total number of threads completed in the current scenario.
- Average: The average response time.
- Median: The statistical median of the response time.
- 90% Line: The response time below which 90% of all threads fall.
- Min: The minimum response time.
- Max: The maximum response time.
- Error: The error rate.
- Throughput: The number of requests processed per unit of time.
- KB/sec: Throughput measured in terms of data transferred per second.
2.2 Underlying storage
RocksDB is used for backend storage, HugeGraph and RocksDB are both started on the same machine, and the configuration files related to the server remain as default except for the modification of the host and port.
- The speed of inserting a single vertex and edge in HugeGraph is about 1w per second
- The batch insertion speed of vertices and edges is much faster than the single insertion speed
- The concurrency of querying vertices and edges by id can reach more than 13000, and the average delay of requests is less than 50ms
4 Test results and analysis
4.1 batch insertion
4.1.1 Upper limit stress testing
Test methods
The upper limit of stress testing is to continuously increase the concurrency and test whether the server can still provide services normally.
Stress Parameters
Duration: 5 minutes
Maximum insertion speed for vertices:
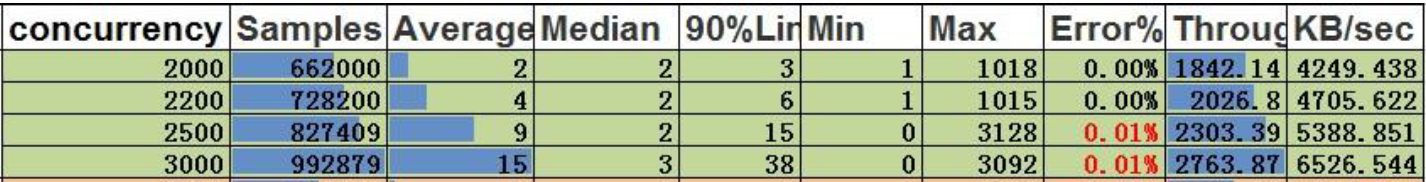
in conclusion:
- With a concurrency of 2200, the throughput for vertices is 2026.8. This means that the system can process data at a rate of 405360 per second (2026.8 * 200).
Maximum insertion speed for edges
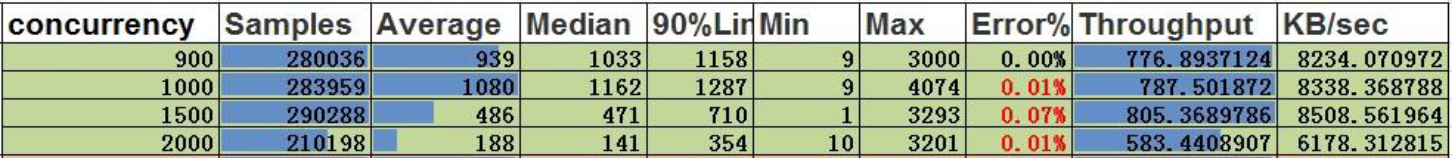
Conclusion:
- With a concurrency of 900, the throughput for edges is 776.9. This means that the system can process data at a rate of 388450 per second (776.9 * 500).
4.2 Single insertion
4.2.1 Stress limit testing
Test Methods
Stress limit testing is a process of continuously increasing the concurrency level to test the upper limit of the server’s ability to provide normal service.
Stress parameters
- Duration: 5 minutes.
- Service exception indicator: Error rate greater than 0.00%.
Single vertex insertion
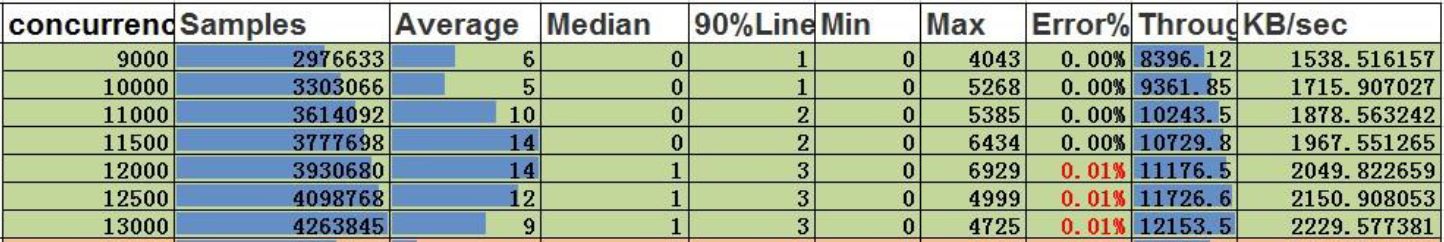
Conclusion:
- With a concurrency of 11500, the throughput is 10730. This means that the system can handle a single concurrent insertion of vertices at a concurrency level of 11500.
Single edge insertion
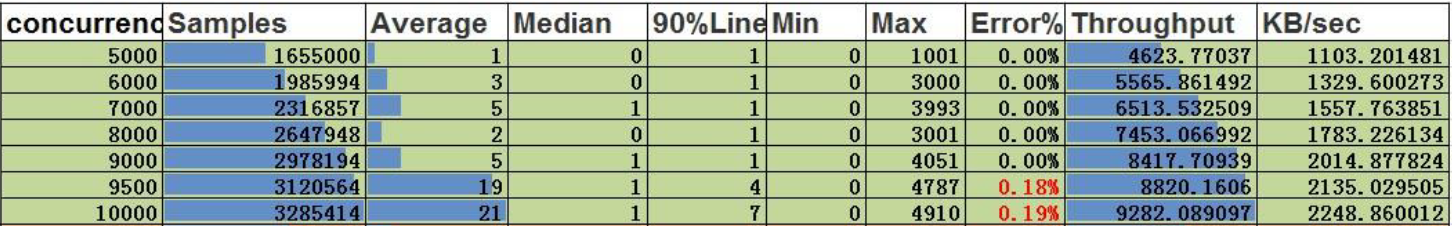
Conclusion:
- With a concurrency of 9000, the throughput is 8418. This means that the system can handle a single concurrent insertion of edges at a concurrency level of 9000.
4.3 Search by ID
4.3.1 Stress test upper limit
Testing method
Continuously increasing the concurrency level to test the upper limit of the server’s ability to provide service under normal conditions.
stress parameters
- Duration: 5 minutes
- Service abnormality indicator: error rate greater than 0.00%
Querying vertices by ID
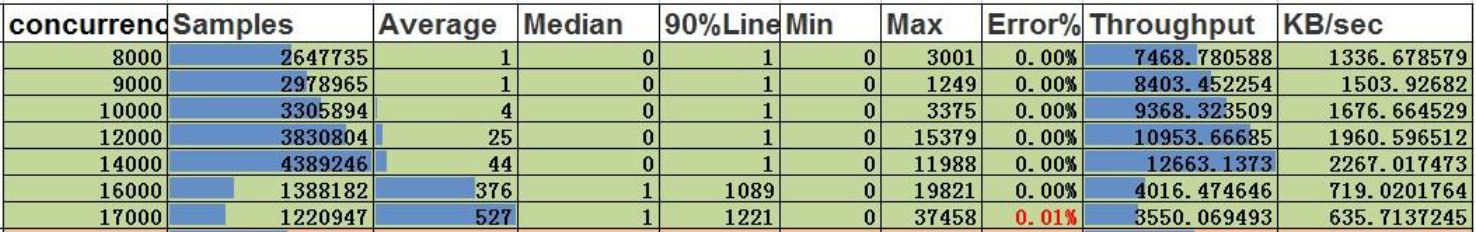
Conclusion:
- Concurrency is 14,000, throughput is 12,663. The concurrency capacity for querying vertices by ID is 14,000, with an average delay of 44ms.
Querying edges by ID
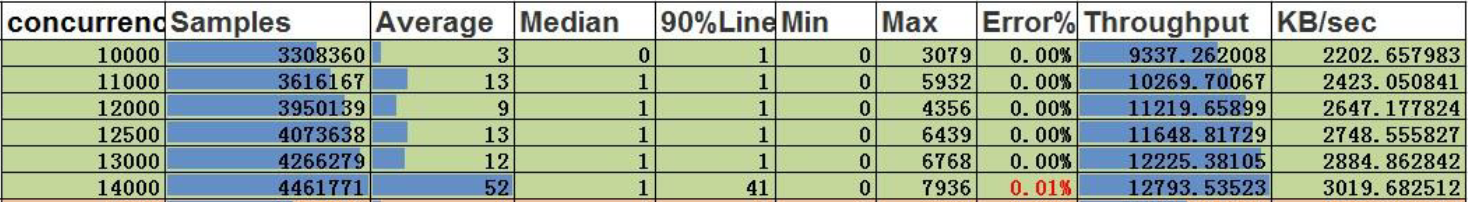
Conclusion:
- Concurrency is 13,000, throughput is 12,225. The concurrency capacity for querying edges by ID is 13,000, with an average delay of 12ms.
2 - v0.5.6 Cluster(Cassandra)
Note:
The current performance metrics are based on an earlier version. The latest version has significant
improvements in both performance and functionality. We encourage you to refer to the most recent release featuring
autonomous distributed storage and enhanced computational push down capabilities. Alternatively,
you may wait for the community to update the data with these enhancements.
1 Test environment
Compressed machine information
| CPU | Memory | 网卡 | 磁盘 |
|---|
| 48 Intel(R) Xeon(R) CPU E5-2650 v4 @ 2.20GHz | 128G | 10000Mbps | 750GB SSD,2.7T HDD |
- Starting Pressure Machine Information: Configure the same as the compressed machine.
- Testing tool: Apache JMeter 2.5.1.
Note: The machine used to initiate the load and the machine being tested are located in the same data center (or server room)
2 Test Description
2.1 Definition of terms (the unit of time is ms)
- Samples – The total number of threads completed in this scenario.
- Average – The average response time.
- Median – The median response time in statistical terms.
- 90% Line – The response time below which 90% of all threads fall.
- Min – The minimum response time.
- Max – The maximum response time.
- Error – The error rate.
- Throughput – The number of transactions processed per unit of time.
- KB/sec – The throughput measured in terms of data transmitted per second.
2.2 Low-Level Storage
A 15-node Cassandra cluster is used for backend storage. HugeGraph and the Cassandra cluster are located on separate servers. Server-related configuration files are modified only for host and port settings, while the rest remain default.
- The speed of a single vertex and edge insertion in HugeGraph is 9000 and 4500 per second, respectively.
- The speed of bulk vertex and edge insertion is 50,000 and 150,000 per second, respectively, which is much higher than the single insertion speed.
- The concurrency for querying vertices and edges by ID can reach more than 12,000, and the average request delay is less than 70ms.
4 Test Results and Analysis
4.1 Batch Insertion
4.1.1 Pressure Upper Limit Test
Test Method
Continuously increase the concurrency level to test the upper limit of the server’s ability to provide services.
Pressure Parameters
Duration: 5 minutes.
Maximum Insertion Speed of Vertices:
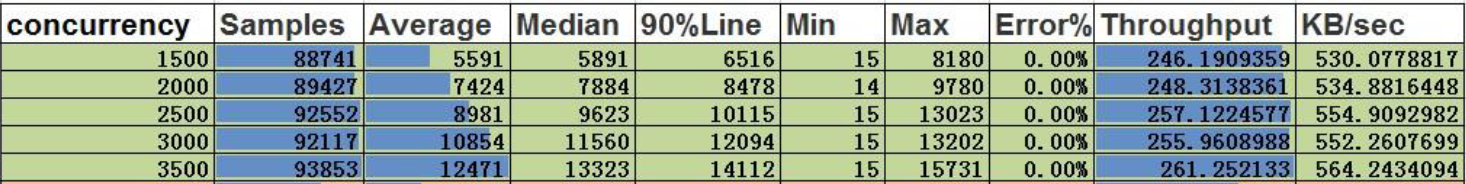
Conclusion:
- At a concurrency level of 3500, the throughput of vertices is 261, and the amount of data processed per second is 52,200 (261 * 200).
Maximum Insertion Speed of Edges:

Conclusion:
- At a concurrency level of 1000, the throughput of edges is 323, and the amount of data processed per second is 161,500 (323 * 500).
4.2 Single Insertion
4.2.1 Pressure Upper Limit Test
Test Method
Continuously increase the concurrency level to test the upper limit of the server’s ability to provide services.
Pressure Parameters
- Duration: 5 minutes.
- Service exception mark: Error rate greater than 0.00%.
Single Insertion of Vertices:
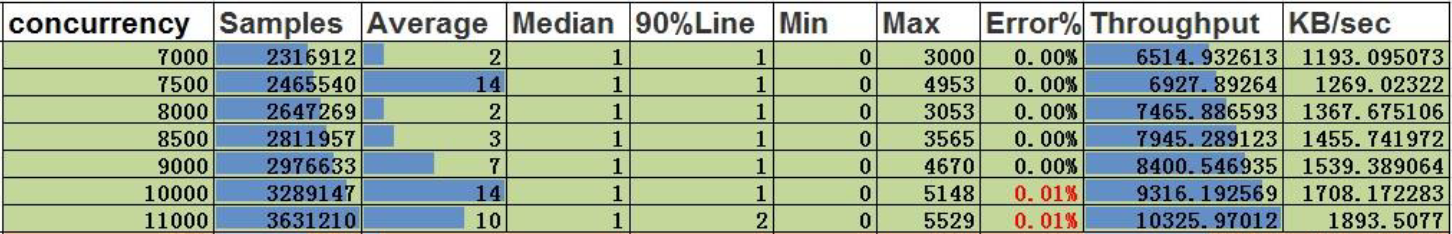
Conclusion:
- At a concurrency level of 9000, the throughput is 8400, and the single-insertion concurrency capability for vertices is 9000.
Single Insertion of Edges:
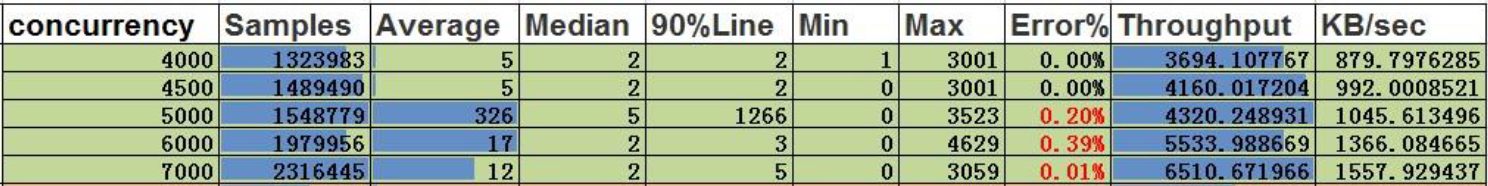
Conclusion:
- At a concurrency level of 4500, the throughput is 4160, and the single-insertion concurrency capability for edges is 4500.
4.3 Query by ID
4.3.1 Pressure Upper Limit Test
Test Method
Continuously increase the concurrency and test the upper limit of the pressure that the server can still provide services normally.
Pressure Parameters
- Duration: 5 minutes
- Service exception flag: error rate greater than 0.00%
Query by ID for vertices
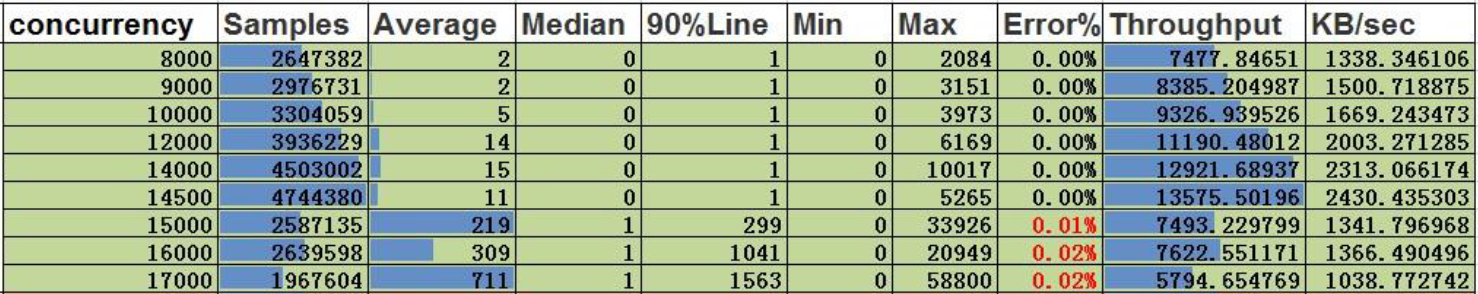
Conclusion:
- The concurrent capacity of the vertex search by ID is 14500, with a throughput of 13576 and an average delay of 11ms.
Edge search by ID
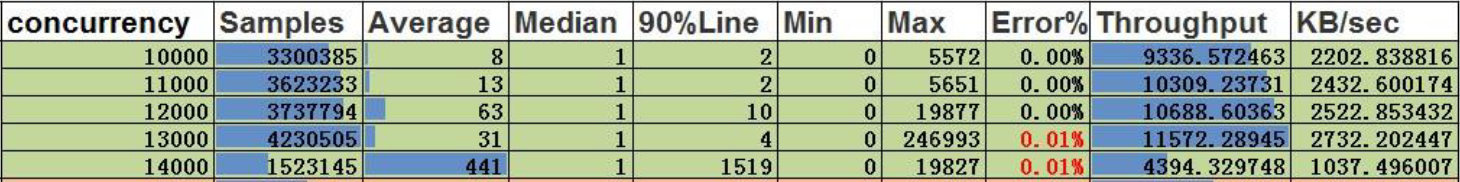
Conclusion:
- For edge ID-based queries, the server’s concurrent capacity is up to 12,000, with a throughput of 10,688 and an average latency of 63ms.