v0.4.4
1 Test environment
Target Machine Information
| 机器编号 | CPU | Memory | NIC (Network Interface Card) | Disk |
|---|---|---|---|---|
| 1 | 24 Intel(R) Xeon(R) CPU E5-2620 v2 @ 2.10GHz | 61G | 1000Mbps | 1.4T HDD |
| 2 | 48 Intel(R) Xeon(R) CPU E5-2650 v4 @ 2.20GHz | 128G | 10000Mbps | 750GB SSD,2.7T HDD |
- Pressure testing machine information: Configured the same as machine number 1.
- Testing tool: Apache JMeter 2.5.1.
Note: The pressure testing machine and the machine being tested are in the same room.
2 Test Description
2.1 Definition of terms (the unit of time is ms)
- Samples – The total number of threads completed in this scenario.
- Average – The average response time.
- Median – The median response time in terms of statistical significance.
- 90% Line – The response time of 90% of all threads is less than xx.
- Min – The minimum response time.
- Max – The maximum response time.
- Error – The error rate.
- Throughput – The throughput.
- KB/sec – The throughput measured in terms of traffic.
2.2 Underlying storage
RocksDB is used for backend storage, HugeGraph and RocksDB are both started on the same machine, and the configuration files related to the server remain the default except for the modification of the host and port.
3 Summary of performance results
- The upper limit of the number of requests HugeGraph can handle per second is 7000
- The speed of batch insertion is much higher than that of single insertion, and the test results on the server reach 22w edges/s, 37w vertices/s
- The backend is RocksDB, and increasing the number of CPUs and memory size can improve the performance of batch inserts. Doubling the CPU and memory size can increase performance by 45% to 60%.
- In the batch insertion scenario, using SSD instead of HDD, the performance improvement is small, only 3%-5%
4 Test results and analysis
4.1 Batch insertion
4.1.1 Maximum Pressure Test
Test Methods
Continuously increase the concurrency level and test the upper limit of the server’s ability to provide services normally.
Pressure Parameters
Duration: 5 minutes
Maximum Insertion Speed of Vertices and Edges (High-performance server with SSD storage for RocksDB data):

Conclusion:
- With a concurrency of 1000, the edge throughput is 451, which can process 225,500 data per second: 451 * 500 = 225,500/s.
- With a concurrency of 2000, the vertex throughput is 1842.4, which can process 368,480 data per second: 1842.4 * 200 = 368,480/s.
1. The Impact of CPU and Memory on Insertion Performance (Servers Using HDD Storage for RocksDB Data, Batch Insertion)
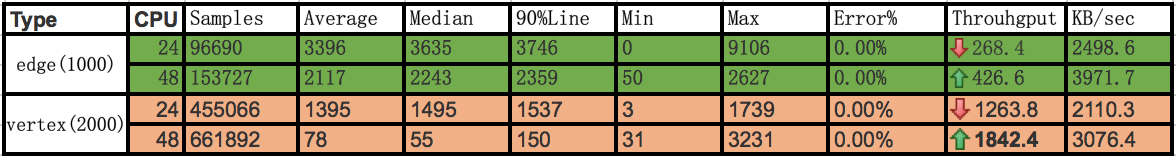
Conclusion:
- With the same HDD disk, doubling the CPU and memory size increases edge throughput from 268 to 426, which improves performance by about 60%.
- With the same HDD disk, doubling the CPU and memory size increases vertex throughput from 1263.8 to 1842.4, which improves performance by about 45%.
2. The Impact of SSD and HDD on Insertion Performance (High-performance Servers, Batch Insertion)
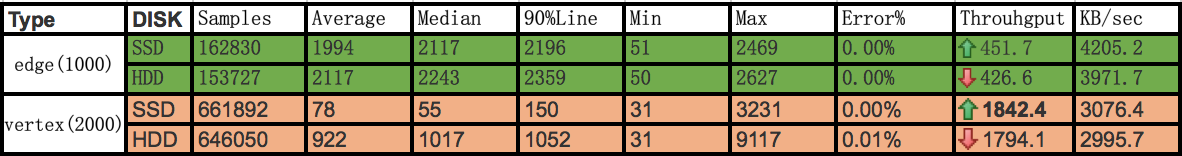
Conclusion:
- For edge insertion, using SSD yields a throughput of 451.7, while using HDD yields a throughput of 426.6, which results in a 5% performance improvement.
- For vertex insertion, using SSD yields a throughput of 1842.4, while using HDD yields a throughput of 1794, which results in a performance improvement of about 3%.
3. The Impact of Different Concurrent Thread Numbers on Insertion Performance (Ordinary Servers, HDD Storage for RocksDB Data)
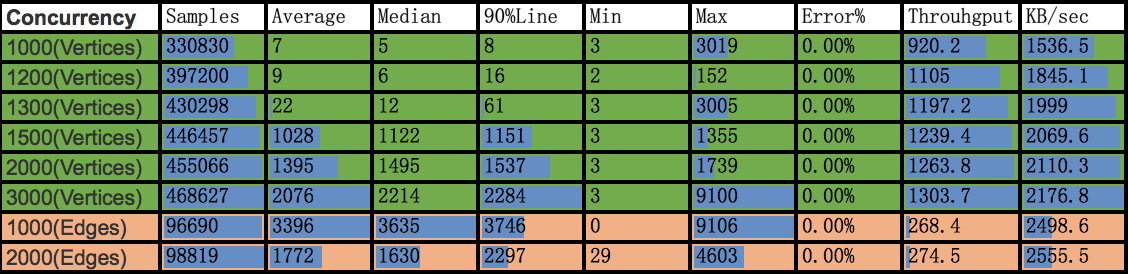
Conclusion:
- For vertices, at 1000 concurrency, the response time is 7ms and at 1500 concurrency, the response time is 1028ms. The throughput remained around 1300, indicating that the inflection point data should be around 1300. At 1300 concurrency, the response time has reached 22ms, which is within a controllable range. Compared to HugeGraph 0.2 (1000 concurrency: average response time 8959ms), the processing capacity has made a qualitative leap.
- For edges, the processing time is too long and exceeds 3 seconds from 1000 to 2000 concurrency, and the throughput almost fluctuates around 270. Therefore, increasing the concurrency will not significantly increase the throughput. 270 is an inflection point, and compared with HugeGraph 0.2 (1000 concurrency: average response time 31849ms), the processing capacity has improved significantly.
4.2 single insertion
4.2.1 Upper Limit Test under Pressure
Test Method
Continuously increase the concurrency level and test the upper limit of the pressure at which the server can still provide normal services.
Pressure Parameters
- Duration: 5 minutes
- Service exception criteria: Error rate greater than 0.00%.
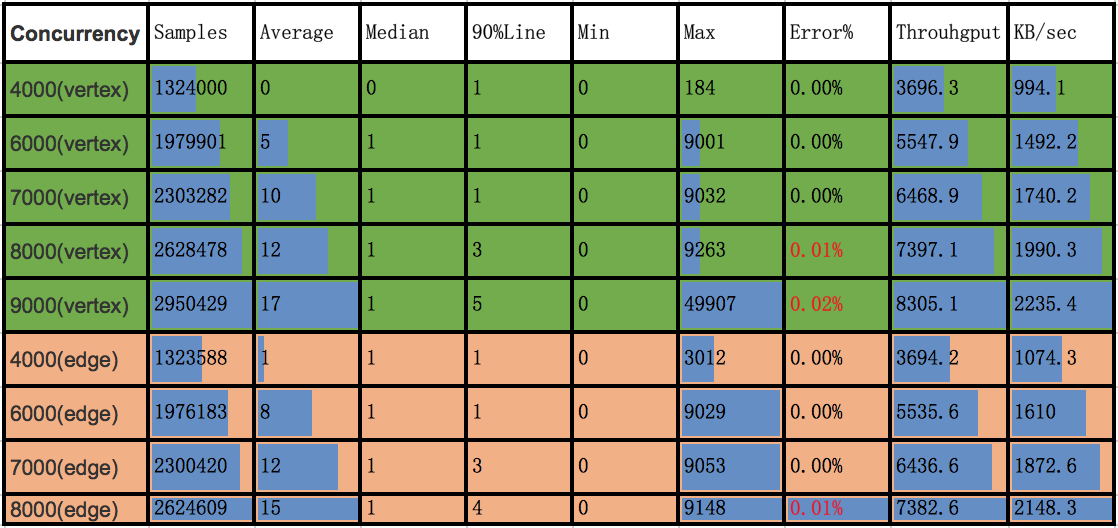
Conclusion:
- Vertices:
- At 4000 concurrent connections, there were no errors, with an average response time of less than 1ms. At 6000 concurrent connections, there were no errors, with an average response time of 5ms, which is acceptable.
- At 8000 concurrent connections, there were 0.01% errors and the system could not handle it, resulting in connection timeout errors. The system’s peak performance should be around 7000 concurrent connections.
- Edges:
- At 4000 concurrent connections, the response time was 1ms. At 6000 concurrent connections, there were no abnormalities, with an average response time of 8ms. The main differences were in IO network recv and send as well as CPU usage.
- At 8000 concurrent connections, there was a 0.01% error rate, with an average response time of 15ms. The turning point should be around 7000 concurrent connections, which matches the vertex results.